Draw Arcs/Circle with Canvas: HTML5

Today lets learn how to use arcs and paths to draw circle.

Arcs are curves that are portions of a circle. A full circle is a 360 degree arc!
A Path is a collection of some lines(or shapes) that once defined can be either filled or stroked.

index.html and myStyle.css files are kept same as illustrated in previous video tutorial: Canvas State: HTML5

Syntax
arc(x, y, r, sA, eA, TF);

arc method takes 6 parameters. x and y are the x-axis and y-axis, which is the center of the circle.
i.e., The x and y parameters determine where the center of the circle will be located on your canvas.

r is the radius of the circle, in pixels.
i.e., the distance of the curve from the center of the circle.

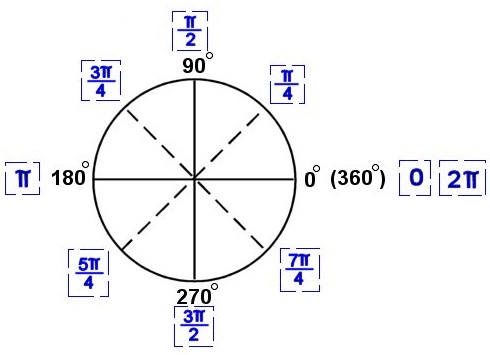
sA is start angle of the circle.
eA is the end angle of the circle.

TF is the direction – which can take 2 values i.e., True or False.

True: negative degrees, counter-clockwise direction.
False: positive degrees, clockwise direction.

Javascript file
myScript.js

1
2
3
4
5
6
7
8
9
10
11
12
13
14
15
16
17
18
19
20
21
22
23
24
25
window.onload = canvas;
 
function canvas()
{
var myCanvas = document.getElementById("myCanvas");
 
if( myCanvas && myCanvas.getContext("2d") ) 
{
var context         = myCanvas.getContext("2d");
 
context.lineWidth= 6;
context.beginPath();
 
var degree = 270;
var radian = ( Math.PI / 180 ) * degree;
 
context.arc(100, 100, 50, 0, radian, false);
context.strokeStyle= "red";
context.fillStyle= "blue";
context.stroke();
context.fill();
context.closePath();
 
}
}

Degree to Radian

radians-and-degrees

We convert degrees to radians using a simple mathematical formula:
Radians = (PI / 180 ) * degree;

Draw Arcs/Circle with Canvas: HTML5


[youtube https://www.youtube.com/watch?v=vE0bstctkp4]

YouTube Link: https://www.youtube.com/watch?v=vE0bstctkp4 [Watch the Video In Full Screen.]


Note:
1. By default, direction of drawing the arc is clockwise/positive degrees(i.e., the value of last parameter is false).
2. PI value is 180.
3. 2 * PI is 360!
4. arc method should be passed with radian values and not degrees.
Line Joining In Canvas: HTML5

Lets quickly learn about Line Joins in Canvas.

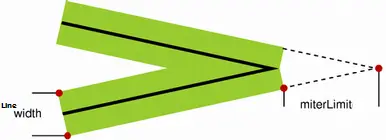
The property we’re using is lineJoin. It has 3 values: round, bevel, miter.
We also look at miter limit.

canvas-lineJoin-miter-miterlimit

index.html and myStyle.css files are kept same as illustrated in previous video tutorial: Canvas State: HTML5

Javascript file: Rounded Join
myScript.js

1
2
3
4
5
6
7
8
9
10
11
12
13
14
15
16
17
18
19
20
21
22
23
window.onload = canvas;
 
function canvas()
{
var myCanvas = document.getElementById("myCanvas");
 
if( myCanvas && myCanvas.getContext("2d") ) 
{
var context = myCanvas.getContext("2d");
 
context.lineWidth= 6;
context.lineJoin= "round";
context.beginPath();
context.moveTo(40, 10);
context.lineTo(25, 190);
context.lineTo(180, 190);
context.closePath();
context.strokeStyle= "red";
context.stroke();
context.fillStyle= "blue";
context.fill();
}
}

Javascript file: Bevel Join
myScript.js

1
2
3
4
5
6
7
8
9
10
11
12
13
14
15
16
17
18
19
20
21
22
23
window.onload = canvas;
 
function canvas()
{
var myCanvas = document.getElementById("myCanvas");
 
if( myCanvas && myCanvas.getContext("2d") ) 
{
var context = myCanvas.getContext("2d");
 
context.lineWidth= 6;
context.lineJoin= "bevel";
context.beginPath();
context.moveTo(40, 10);
context.lineTo(25, 190);
context.lineTo(180, 190);
context.closePath();
context.strokeStyle= "red";
context.stroke();
context.fillStyle= "blue";
context.fill();
}
}

Javascript file: Miter Join
myScript.js

1
2
3
4
5
6
7
8
9
10
11
12
13
14
15
16
17
18
19
20
21
22
23
24
window.onload = canvas;
 
function canvas()
{
var myCanvas = document.getElementById("myCanvas");
 
if( myCanvas && myCanvas.getContext("2d") ) 
{
var context = myCanvas.getContext("2d");
 
context.lineWidth= 6;
context.lineJoin= "miter";
context.miterLimit= 1;
context.beginPath();
context.moveTo(40, 10);
context.lineTo(25, 190);
context.lineTo(180, 190);
context.closePath();
context.strokeStyle= "red";
context.stroke();
context.fillStyle= "blue";
context.fill();
}
}

Here we draw a triangle which is of 6px line width, with red and blue border and fill respectively. Each time we change the value of lineJoin and illustrate different lineJoins in HTML5 Canvas.

Line Joining In Canvas: HTML5


[youtube https://www.youtube.com/watch?v=QSdWeuVuyX4]

YouTube Link: https://www.youtube.com/watch?v=QSdWeuVuyX4 [Watch the Video In Full Screen.]


Miter join is the default join. And we can control the sharpness of the edge or convert it to bevel join (control the edge/join folding ) using miterLimit property.

Line Ending In Canvas: HTML5

Today lets learn about line ending properties present in HTML5.

The property we’re using is lineCap. It has 3 values: butt, round, square.

index.html and myStyle.css files are kept same as illustrated in previous video tutorial: Canvas State: HTML5

Javascript file: First Line
myScript.js

1
2
3
4
5
6
7
8
context.lineWidth=15;
 
context.beginPath();
context.lineCap="butt";
context.moveTo(10, 50);
context.lineTo(190, 50);
context.strokeStyle="red";
context.stroke();

Here we set the lineWidth to 15px. Begin the path and give it a lineCap(line ending) value of butt, and make it red colored.

Javascript file: Second and third Line
myScript.js

1
2
3
4
5
6
7
8
9
10
11
12
13
context.beginPath();
context.lineCap="round";
context.moveTo(10, 75);
context.lineTo(190, 75);
context.strokeStyle="blue";
context.stroke();
 
context.beginPath();
context.lineCap="square";
context.moveTo(10, 100);
context.lineTo(190, 100);
context.strokeStyle="green";
context.stroke();

Similarly, we draw 2 more lines: with round and square lineCap and blue and green colors respectively.

Javascript file: line endings
myScript.js

1
2
3
4
5
6
7
8
9
10
11
12
context.lineWidth=1;
context.beginPath();
context.moveTo(10, 0);
context.lineTo(10, 200);
context.strokeStyle="pink";
context.stroke();
 
context.beginPath();
context.moveTo(190, 0);
context.lineTo(190, 200);
context.strokeStyle="pink";
context.stroke();

Here we change the lineWidth to 1px. Then mark a border and separate the line ending shapes with the actual line itself.

Full Javascript Code file
myScript.js

1
2
3
4
5
6
7
8
9
10
11
12
13
14
15
16
17
18
19
20
21
22
23
24
25
26
27
28
29
30
31
32
33
34
35
36
37
38
39
40
41
42
43
44
45
46
47
48
49
50
window.onload = canvas;
 
function canvas()
{
var myCanvas = document.getElementById("myCanvas");
 
if( myCanvas && myCanvas.getContext("2d") ) 
{
var context= myCanvas.getContext("2d");
 
 
context.lineWidth = 15;
 
context.beginPath();
context.lineCap="butt";
context.moveTo(10, 50);
context.lineTo(190, 50);
context.strokeStyle= "red";
context.stroke();
 
context.beginPath();
context.lineCap="round";
context.moveTo(10, 75);
context.lineTo(190, 75);
context.strokeStyle = "blue";
context.stroke();
 
context.beginPath();
context.lineCap="square";
context.moveTo(10, 100);
context.lineTo(190, 100);
context.strokeStyle = "green";
context.stroke();
 
context.lineWidth= 1;
context.beginPath();
context.moveTo(10, 0);
context.lineTo(10, 200);
context.strokeStyle= "pink";
context.stroke();
 
context.beginPath();
context.moveTo(190, 0);
context.lineTo(190, 200);
context.strokeStyle= "pink";
context.stroke();
 
 
}
}

Line Ending In Canvas: HTML5


[youtube https://www.youtube.com/watch?v=FcoonQCq2Jw]

YouTube Link: https://www.youtube.com/watch?v=FcoonQCq2Jw [Watch the Video In Full Screen.]


By default line ending(lineCap) has a value butt.

In our next video lessons, lets learn about the curves.

Canvas Lines and Paths: HTML5

Today we shall learn how to draw shapes other than rectangle, with the help of LINES and PATHS.

A PATH is a collection of lines(or shapes) that once defined can be either filled or stroked.

A LINE can be created with different settings. We can specify where they start, how they join each other, and how they end.

We have different set of methods and properties to handle drawing lines:
beginPath() as the name suggests, begins a new set of path drawing operation.
moveTo(x, y) doesn’t draw anything. But it places the pointer to the x and y position we specify as argument.
lineTo(x, y) actually draws the line from the moveTo(x, y) point to the new lineTo(x, y) point.
lineWidth Sets the width of the drawing lines.

index.html and myStyle.css files are kept same as illustrated in previous video tutorial: Canvas State: HTML5

JavaScript file
myScript.js

1
2
3
4
5
6
7
8
9
10
11
12
13
14
15
16
17
18
19
20
21
22
23
24
25
window.onload = canvas;
 
function canvas()
{
var myCanvas = document.getElementById("myCanvas");
 
if( myCanvas && myCanvas.getContext("2d") ) 
{
var context         = myCanvas.getContext("2d");
 
context.beginPath();
context.moveTo(30, 30);
context.lineTo(100, 40);
context.lineTo(100, 190);
context.closePath();
 
context.strokeStyle  = "red";
context.lineWidth = 5;
context.stroke();
 
context.fillStyle    = "blue";
context.fill();
 
}
}

We begin the path and place the initial drawing point to 30px x-axis and 30px y-axis using moveTo() method. Next we sketch a line to 100px x-axis and 40px y-axis from moveTo() point, using lineTo() method. Next we draw another line, which is attached to one end of our first line: with 100px x-axis and 190px y-axis. Next we close the path using closePath() method.

This forms a triangle. But yet it is not displayed on our browser, until we call stroke() method, which strokes the lines.

Using strokeStyle and lineWidth properties we set its color and width.

We also assign fill color to blue and call fill() method to fill the color of the PATH(triangle).

Canvas Lines and Paths: HTML5


[youtube https://www.youtube.com/watch?v=9zqRAvmGXlI]

YouTube Link: https://www.youtube.com/watch?v=9zqRAvmGXlI [Watch the Video In Full Screen.]


In our next video tutorial we shall see other properties:

lineCap which determines the ending of lines using 3 properties: butt(default), rounded ends, square ends.
lineJoin which determines hoe the lines join each other: round joint, bevel joint and miter joint(default)
miterLimit is related to miter joint. This is the limit at which the line joins are cut off and are drawn to look like bevel join. It has a default value of 10.

Canvas clearRect: HTML5

Rectangle is the only primitive type supported by canvas.

It has 3 functions:
strokeRect(x, y, w, h);
fillRect(x, y, w, h);
clearRect(x, y, w, h);

In our previous video tutorials we’ve seen using strokeRect and fillRect methods. In this short video tutorial, we’re illustrating clearRect() method.

clearRect method erases the given rectangle and makes the area fully transparent.

index.html and myStyle.css files are kept same as illustrated in previous video tutorial: Canvas State: HTML5

JavaScript file
myScript.js

1
2
3
4
5
6
7
8
9
10
11
12
13
14
15
16
17
18
19
window.onload = canvas;
 
function canvas()
{
var myCanvas = document.getElementById("myCanvas");
 
if( myCanvas && myCanvas.getContext("2d") ) 
{
var context         = myCanvas.getContext("2d");
 
context.fillStyle = "red";
context.fillRect(10, 10, 75, 75);
 
context.fillStyle = "blue";
context.fillRect(90, 10, 75, 75);
 
context.clearRect(5, 40, 200, 40)
}
}

Here we first draw 2 rectangles: red and blue.
Next clear part of these two rectangles using clearRect method.

We start clearRect() from 5px x-axis, and 40px y-axis; with a width of 200px, so that it covers both red and blue rectangles.

Canvas clearRect: HTML5


[youtube https://www.youtube.com/watch?v=W1W5LEGeqjI]

YouTube Link: https://www.youtube.com/watch?v=W1W5LEGeqjI [Watch the Video In Full Screen.]


Advantages of clearRect() method may not seem obvious at first, but will be helpful in game development – to draw transparent paths between your drawings/graphics.