Quadratic Curve In Canvas: HTML5

Today lets learn to draw quadratic curves on Canvas, using HTML5.

index.html and myStyle.css files are kept same as illustrated in previous video tutorial: Canvas State: HTML5
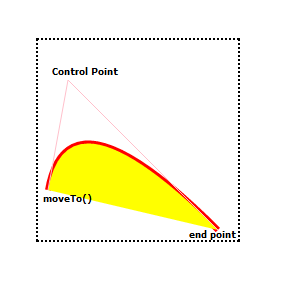
quadratic-curve-canvas-html5

Syntax
quadraticCurveTo(cx, cy, endX, endY);

(cx, cy) are control point.
(endX, endY) are end point of the curve.

You may be wondering about the start point!
We specify it with the help of moveTo() method.

Quadratic curve start at the current pen position using the given control point cx, cy and end at the end points defined by endX, endY.

i.e., Quadratic curves use a starting point, one control point and an end point.

Javascript file: Quadratic Curve
myScript.js

1
2
3
4
5
6
7
8
context.lineWidth= 6;
context.beginPath();
context.moveTo(20, 100);
context.quadraticCurveTo(80, 190, 150, 120);
context.strokeStyle= "red";
context.fillStyle= "yellow";
context.stroke()
context.fill();

With a line width of 6px, we draw a line from 20px x-axis, 100px y-axis and using the control point 80px x-axis, 190px y-axis, we join to the end points 150px x-axis, 120px y-axis.

Javascript file: Control Point
myScript.js

1
2
3
4
5
6
7
context.lineWidth= 1;
context.beginPath();
context.moveTo(20, 100);
context.lineTo(80, 190);
context.lineTo(150, 120);
context.strokeStyle = "pink";
context.stroke();

With the help of the points in Quadratic curve example above, we trace its control points.
moveTo takes the same value.
first lineTo takes control points value.
second lineTo takes end point values of quadratic curves.

Quadratic Curve In Canvas: HTML5


[youtube https://www.youtube.com/watch?v=OMDfbpLBeGc]

YouTube Link: https://www.youtube.com/watch?v=OMDfbpLBeGc [Watch the Video In Full Screen.]


Related:
Draw Arcs/Circle with Canvas: HTML5
Bezier Curve In Canvas: HTML5

Javascript file: Full Code
myScript.js

1
2
3
4
5
6
7
8
9
10
11
12
13
14
15
16
17
18
19
20
21
22
23
24
25
26
27
28
window.onload = canvas;
 
function canvas()
{
var myCanvas = document.getElementById("myCanvas");
 
if( myCanvas && myCanvas.getContext("2d") ) 
{
var context         = myCanvas.getContext("2d");
 
context.lineWidth= 6;
context.beginPath();
context.moveTo(20, 100);
context.quadraticCurveTo(80, 190, 150, 120);
context.strokeStyle= "red";
context.fillStyle= "yellow";
context.stroke()
context.fill();
 
context.lineWidth= 1;
context.beginPath();
context.moveTo(20, 100);
context.lineTo(80, 190);
context.lineTo(150, 120);
context.strokeStyle = "pink";
context.stroke();
}
}

Color Scheme
Curve border – strokeStyle : red
Curve Fill – fillStyle : yellow
Control Point Path : pink
Bezier Curve In Canvas: HTML5

Today lets learn to draw Bezier curves on Canvas, using HTML5.

index.html and myStyle.css files are kept same as illustrated in previous video tutorial: Canvas State: HTML5

bezier-curve-canvas-html5

Syntax
bezierCurveTo(cx1, cy1, cx2, cy2, endX, endY);

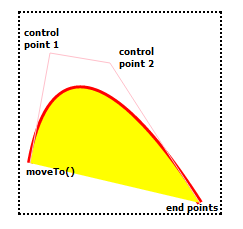
(cx1, cy1) are control point one.
(cx2, cy2) are control point two.
(endX, endY) are end point of the curve.

You may be wondering about the start point!
We specify it with the help of moveTo() method.

Javascript file: Bezier Curve
myScript.js

1
2
3
4
5
6
7
8
context.lineWidth= 6;
context.beginPath();
context.moveTo(10, 150);
context.bezierCurveTo(30, 40, 90, 50, 180, 190);
context.strokeStyle= "red";
context.fillStyle= "yellow";
context.stroke();
context.fill();

With a lineWidth of 6px, we draw a curve with 30px x-axis, 40px y-axis as first control point and 90px x-axis, 50px y-axis as second control point; Also 180px x-axis, 190px y-axis as end points of the curve. Not to forget the starting point, moveTo, which has 10px x-axis and 150px y-axis.

Javascript file: Control Point Path
myScript.js

1
2
3
4
5
6
7
8
context.lineWidth= 1;
context.beginPath();
context.moveTo(10, 150);
context.lineTo(30, 40);
context.lineTo(90, 50);
context.lineTo(180, 190);
context.strokeStyle= "pink";
context.stroke();

With the help of the points in Bezier curve example above, we trace its control points.
moveTo takes the same value.
first lineTo takes first control points value.
second lineTo takes second control point value.
third lineTo takes end point values.

Bezier Curve In Canvas: HTML5


[youtube https://www.youtube.com/watch?v=uQbqB8J7Ua0]

YouTube Link: https://www.youtube.com/watch?v=uQbqB8J7Ua0 [Watch the Video In Full Screen.]


Also learn how to draw lines/path corresponding to the curves, by following the video. This would be an essential skill in real-time web development.

Javascript file: Full Code
myScript.js

1
2
3
4
5
6
7
8
9
10
11
12
13
14
15
16
17
18
19
20
21
22
23
24
25
26
27
28
29
30
31
window.onload = canvas;
 
function canvas()
{
var myCanvas = document.getElementById("myCanvas");
 
if( myCanvas && myCanvas.getContext("2d") ) 
{
var context         = myCanvas.getContext("2d");
 
context.lineWidth= 6;
context.beginPath();
context.moveTo(10, 150);
context.bezierCurveTo(30, 40, 90, 50, 180, 190);
context.strokeStyle= "red";
context.fillStyle= "yellow";
context.stroke();
context.fill();
 
 
context.lineWidth= 1;
context.beginPath();
context.moveTo(10, 150);
context.lineTo(30, 40);
context.lineTo(90, 50);
context.lineTo(180, 190);
context.strokeStyle= "pink";
context.stroke();
 
}
}

Color Scheme
Curve border – strokeStyle : red
Curve Fill – fillStyle : yellow
Control Point Path : pink

Note: You can skip the closePath() method, since there is no use of closing the path in our example above.